A reviewer has asked myself and my co-author to conduct some additional analysis using latent change score modelling for a computational cognitive modelling paper we have submitted. As I have absolutely no idea how to conduct any form of structural equation modelling, I am asking the universe (i.e., you!) for help.
If you can help, please do reach out.
I am conducting all analysis in R, so will be looking to use the (seemingly excellent) lavaan package.
I will provide a quick overview of the paper’s contribution, before outlining the SEM model requested by the reviewer.
Overview of Paper
We have a computational cognitive model that when fit to human response time data provides me with three independent parameters, labelled \(a\), \(v\), and \(t0\). I fit the cognitive model to two experimental conditions. Let’s call these “easy” and “hard” conditions. This then provides 6 parameter values for each participant:
- \(a_{easy}\)
- \(a_{hard}\)
- \(v_{easy}\)
- \(v_{hard}\)
- \(t0_{easy}\)
- \(t0_{hard}\)
When we calculate difference scores—which we call delta (\(\Delta\))—for each parameter by subtracting the easy parameter value from the hard parameter value:
- \(\Delta_{a} = a_{hard} - a_{easy}\)
- \(\Delta_{v} = v_{hard} - v_{easy}\)
- \(\Delta_{t0} = t0_{hard} - t0_{easy}\)
Our paper reports a spurious correlation that emerges between \(\Delta_{a}\) and \(\Delta_{t0}\), something which shouldn’t occur according to the theory we are modelling. We have a preprint on this effect here: https://psyarxiv.com/u6py8.
Reviewer’s Request
The reviewer suggested we attempt to model the correlation between the difference scores at the latent level using latent change score modelling.
The reviewer’s exact wording is:
“An alternative would be to use latent change models to regress model estimates from the hard condition on the easier condition and to then correlate latent changes score of the a-parameter and the t0 parameters”
From my understanding of this request, we could do the following:
- First, split the human trial-level data into “odd” and “even” trials in both the easy and the hard conditions. (Each participant had 1,000 trials in total.)
- Second, fit the cognitive model separately to odd and even trials for both easy and hard conditions.
- Use these as “manifest variables” in an SEM to create latent variables for each parameter for each condition. For example, estimate a latent variable \(a_{easy}\) from the manifest variables \(a_{easy(odd)}\) and \(a_{easy(even)}\).
- Then, have latent variables reflecting the difference between the latent variables between experimental conditions:
- \(\Delta_{a} = a_{hard} - a_{easy}\)
- \(\Delta_{v} = v_{hard} - v_{easy}\)
- \(\Delta_{t0} = t0_{hard} - t0_{easy}\)
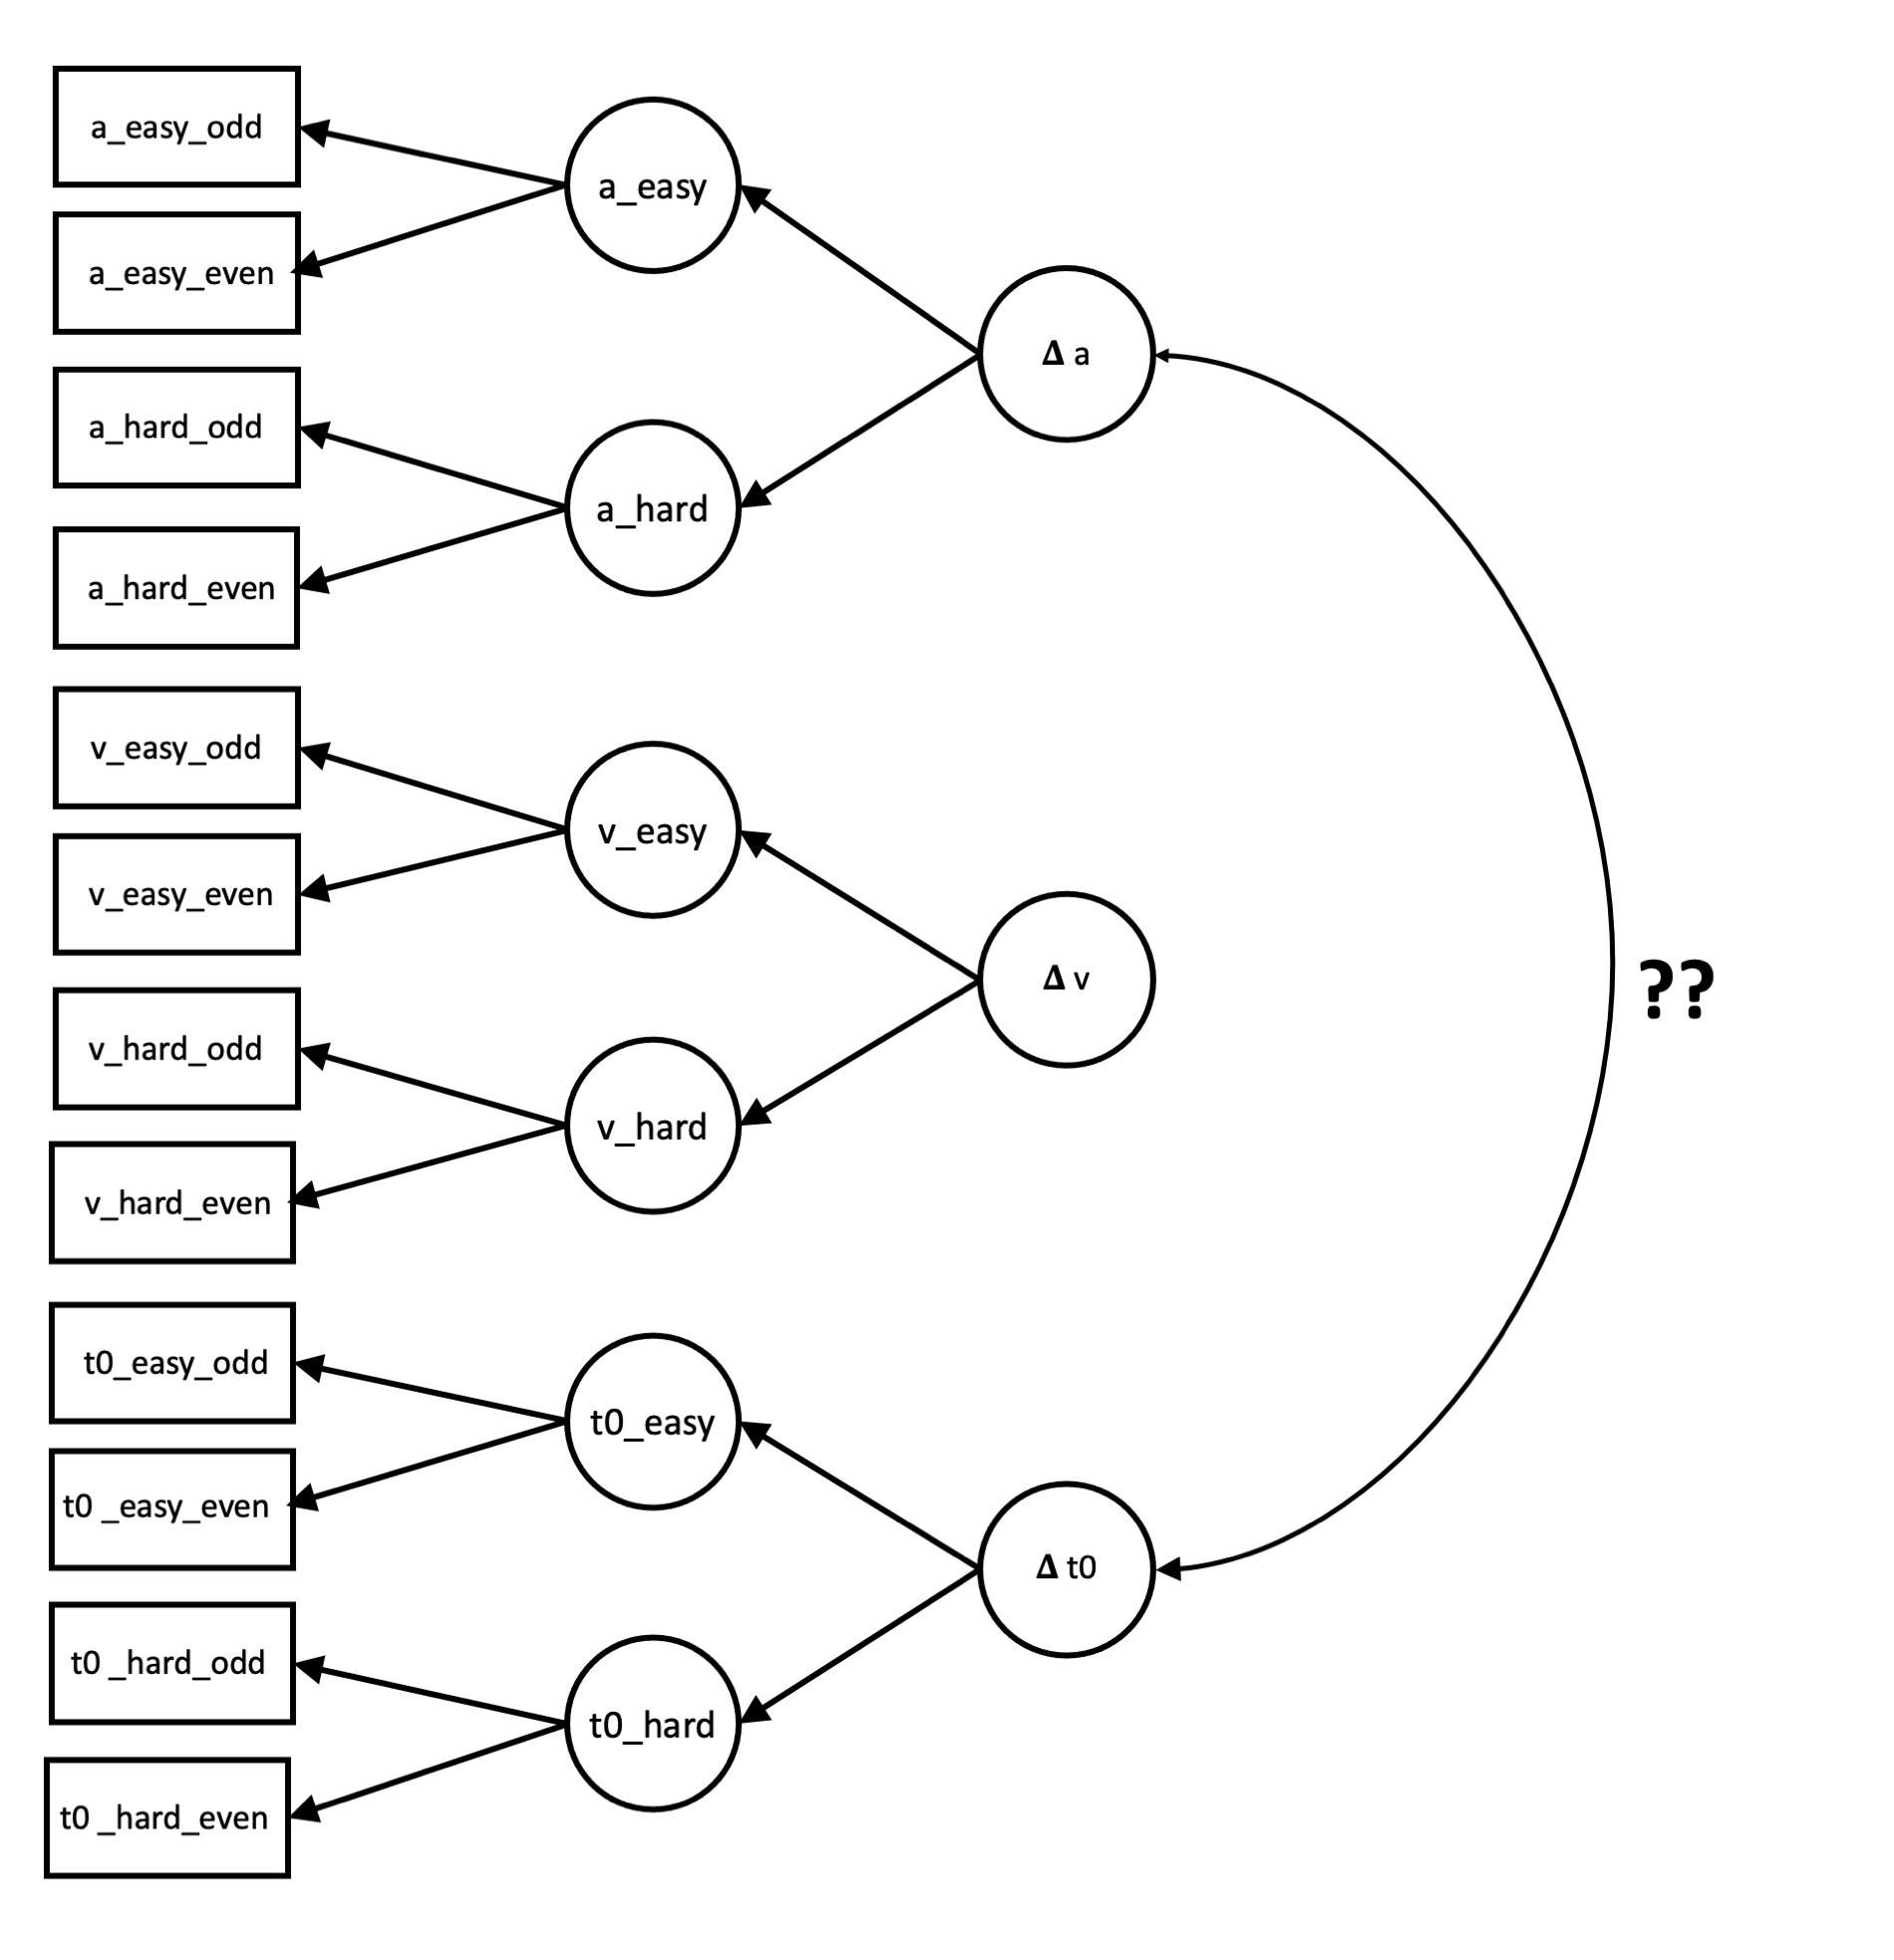
- Then, we are interested in the relationship between \(\Delta_{a}\) and \(\Delta_{t0}\). .
From this description, I’ve knocked up a quick visual of what I think this model looks like (but forgive lack of accuracy in any deviations from how these models are traditionally presented).
My Questions
So, I basically have two questions that we would really apprecitate some help on:
- Is this model properly specified (i.e., can we get the type of analysis we want from the data we have?)?
- (To my admittedly naiive mind, we don’t seem to have enough manifest variables to create so many latent variables, but maybe SEM is much more magic than I thought!)
- How on earth does one create such a model in lavaan? Are there any examples of these types of models with open-source code you could provide? Or any helpful resources to help get started with this?
Fake Data
Here’s some fake data with the same structure as my real data:
library(tidyverse)

# sample size
n <- 500

data <- tibble(
  a_easy_odd = rnorm(n, 0, 1),
  a_easy_even= rnorm(n, 0, 1),
  a_hard_odd = rnorm(n, 0, 1),
  a_hard_even = rnorm(n, 0, 1),
  v_easy_odd = rnorm(n, 0, 1),
  v_easy_even= rnorm(n, 0, 1),
  v_hard_odd = rnorm(n, 0, 1),
  v_hard_even = rnorm(n, 0, 1),
  t0_easy_odd = rnorm(n, 0, 1),
  t0_easy_even= rnorm(n, 0, 1),
  t0_hard_odd = rnorm(n, 0, 1),
  t0_hard_even = rnorm(n, 0, 1)
)

head(data)
## # A tibble: 6 × 12
## a_easy_odd a_easy_even a_hard_odd a_hard_even v_easy_odd v_easy_even
## <dbl> <dbl> <dbl> <dbl> <dbl> <dbl>
## 1 0.834 0.143 -1.02 0.943 1.13 -1.04
## 2 -0.493 1.33 0.497 -0.812 -0.697 0.640
## 3 0.792 -1.34 -1.16 -0.754 -1.80 -0.333
## 4 2.01 1.73 -0.315 -0.363 -1.43 -0.547
## 5 -0.336 -0.742 -1.83 -0.0768 -1.63 0.513
## 6 -1.42 -0.422 0.288 -0.770 -0.936 0.106
## # … with 6 more variables: v_hard_odd <dbl>, v_hard_even <dbl>,
## # t0_easy_odd <dbl>, t0_easy_even <dbl>, t0_hard_odd <dbl>,
## # t0_hard_even <dbl>